51 Maps
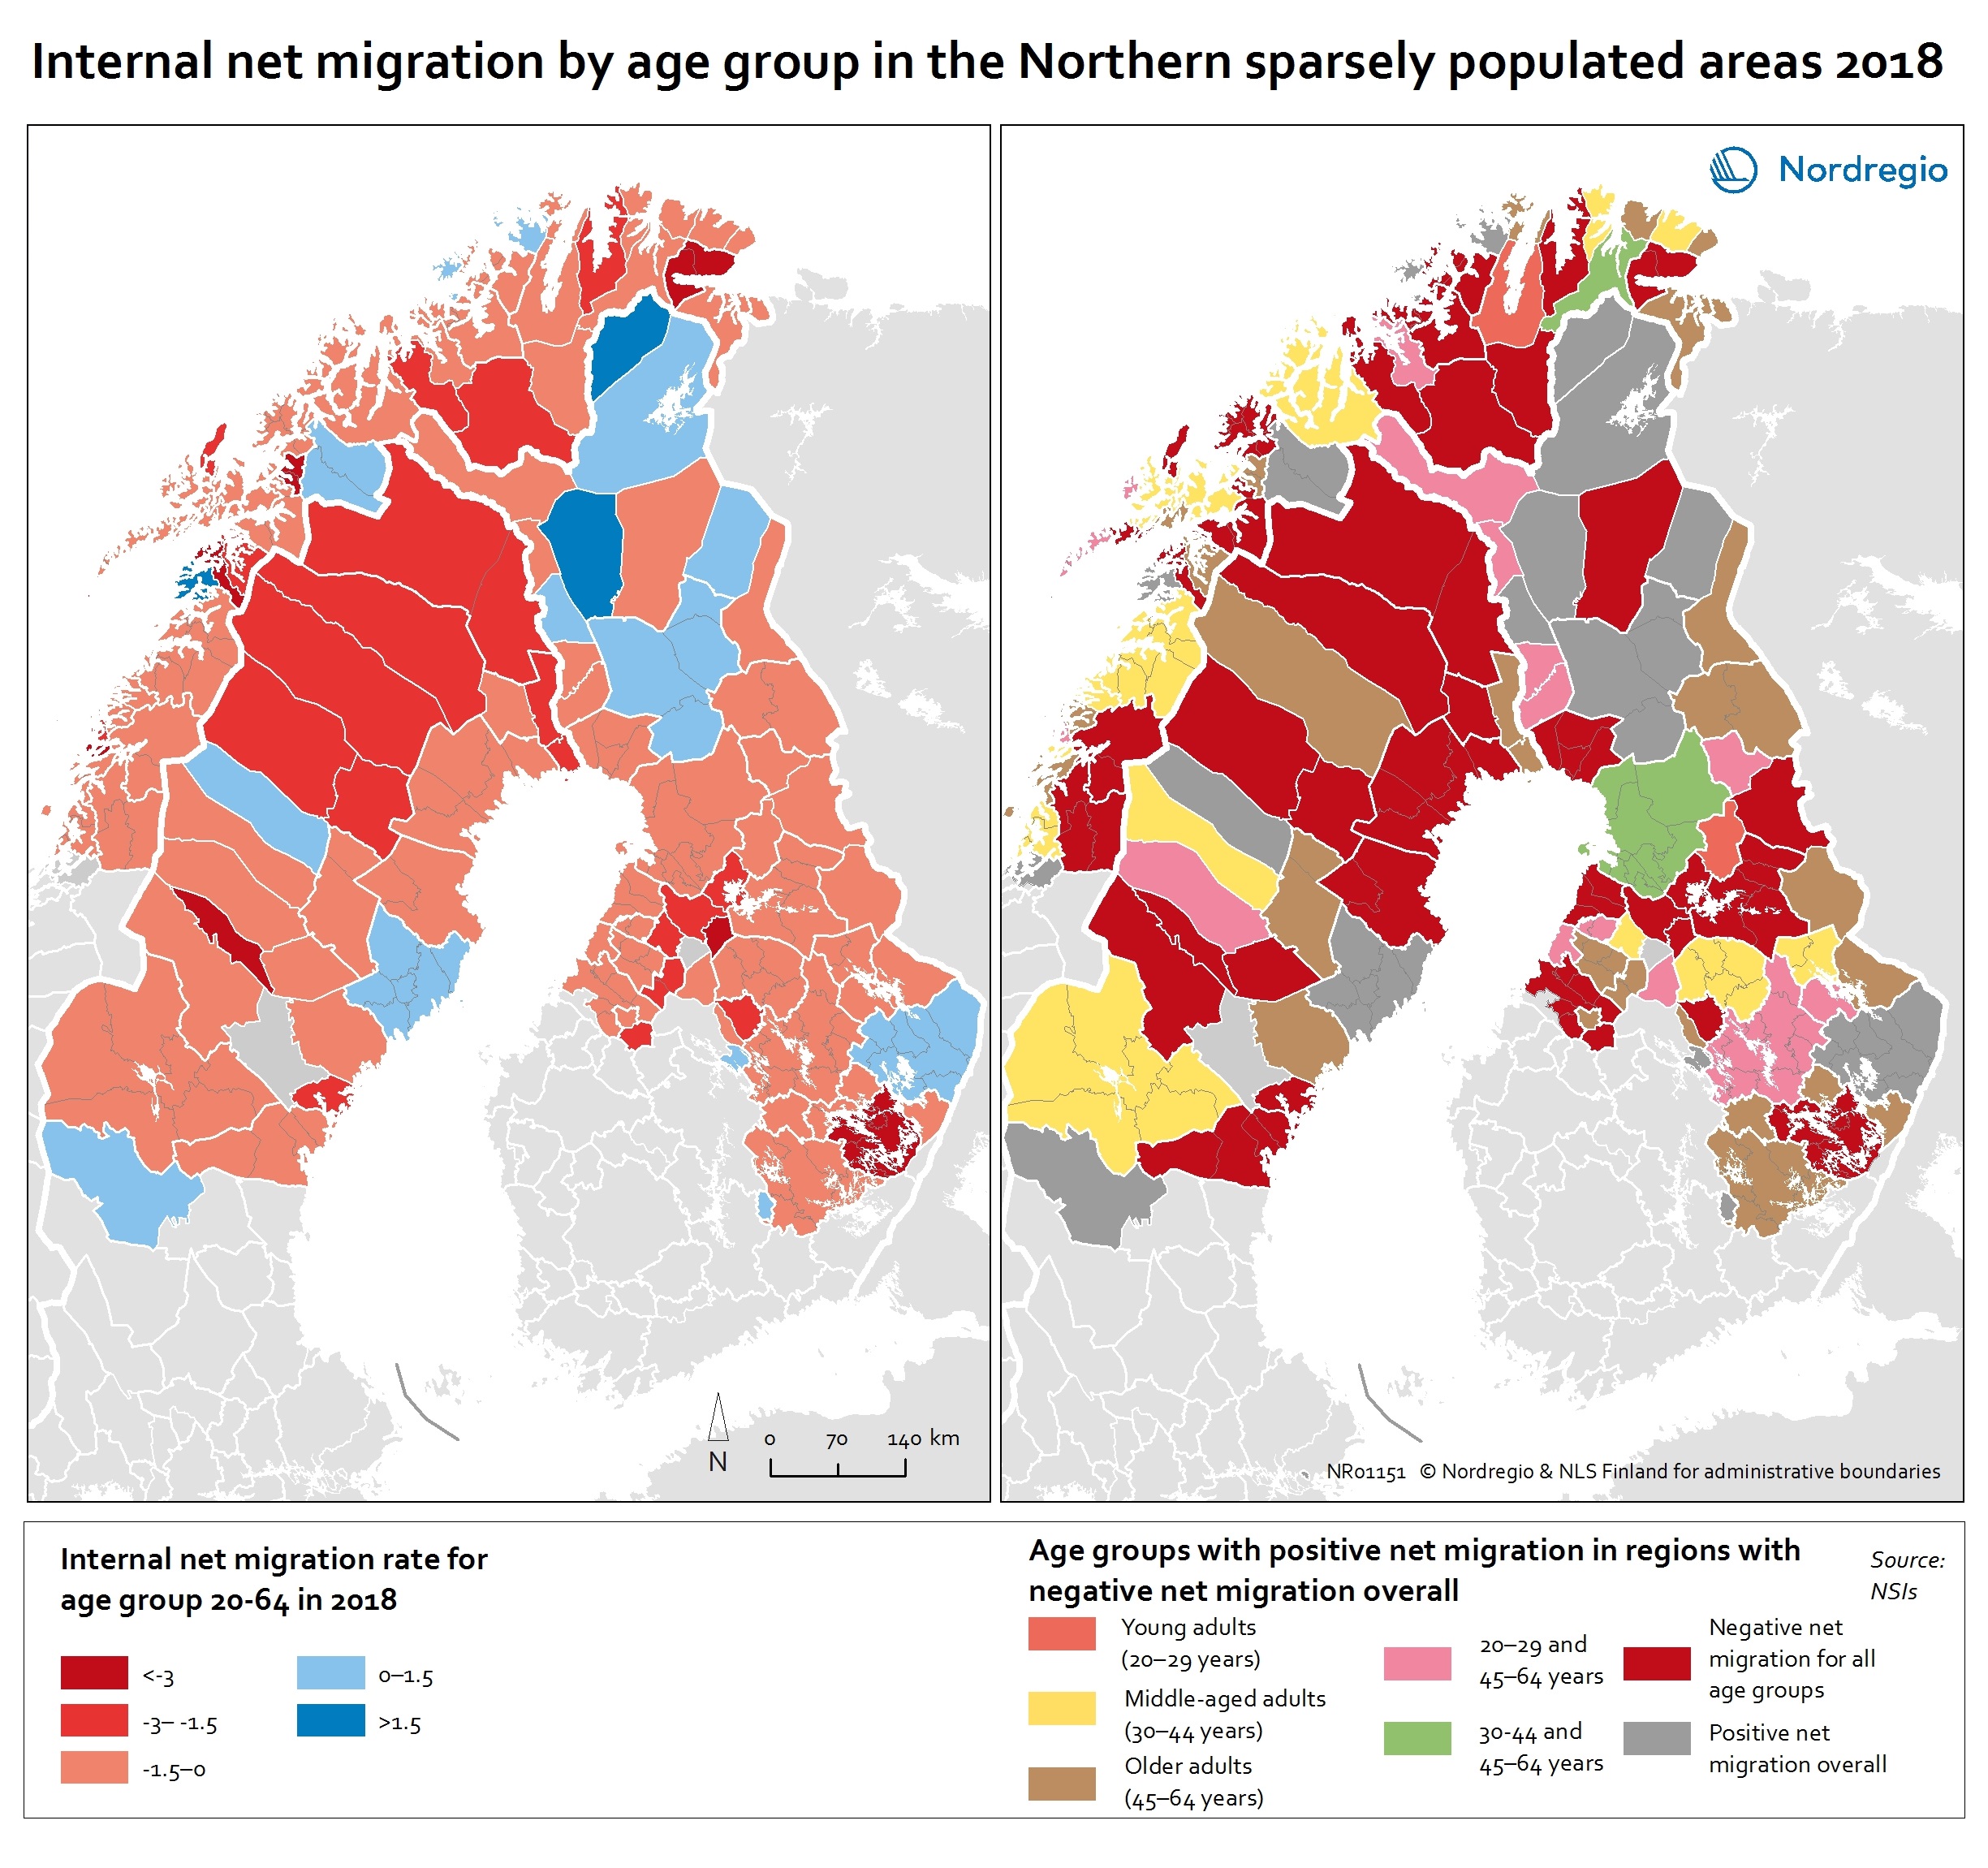
Internal net migration by age group in the Northern sparsely populated areas 2018
This map shows the internal net migration rate in 2018 (left map) and net migration by age group (right map) in local labour market areas of the Northern sparsely populated areas in 2018 The map on left shows the internal net migration rate in the NSPAs in 2018. Although many regions experienced negative net migration, this was not the case for all segments of the population. The map on the right of shows the age groups in which more people moved in than moved out, despite these regions having negative net migration overall. The red colours on the map on the left indicates a net out-migration, while the blue colours indicate a positive net migration. In the map on the right, the red colours indicate net out-migration for all age groups and the grey positive net migration overall. The other colours indicate age groups with a positive net migration (while having negative net migration overall). Inward and outward migration are slightly different in the local labour market areas (LLMAs) compared to the independent labour markets. Among the LLMAs, Rovaniemi is the only one that has positive net migration in all age groups. This positive development may be due to the number of governmental offices, the strength of the tourism industry and the presence of two universities. On the contrary, 18 local labour market areas– four in Sweden, nine in Norway and five in Finland – have negative net migration in all age groups. Out-migration of young adults is seen in most of LLMAs, the exceptions being Umeå, Målsev, Joensuu and Oulu. The inflows of young adults in these regions reflect the presence of the universities in Umeå, Joensuu and Oulu and the army bases in Målselv. Despite this positive inflow, most of these LLMAs are unable to retain adults in…
 2020 February
 - Demography
- Labour force
- Migration
- NSPA and North Atlantic
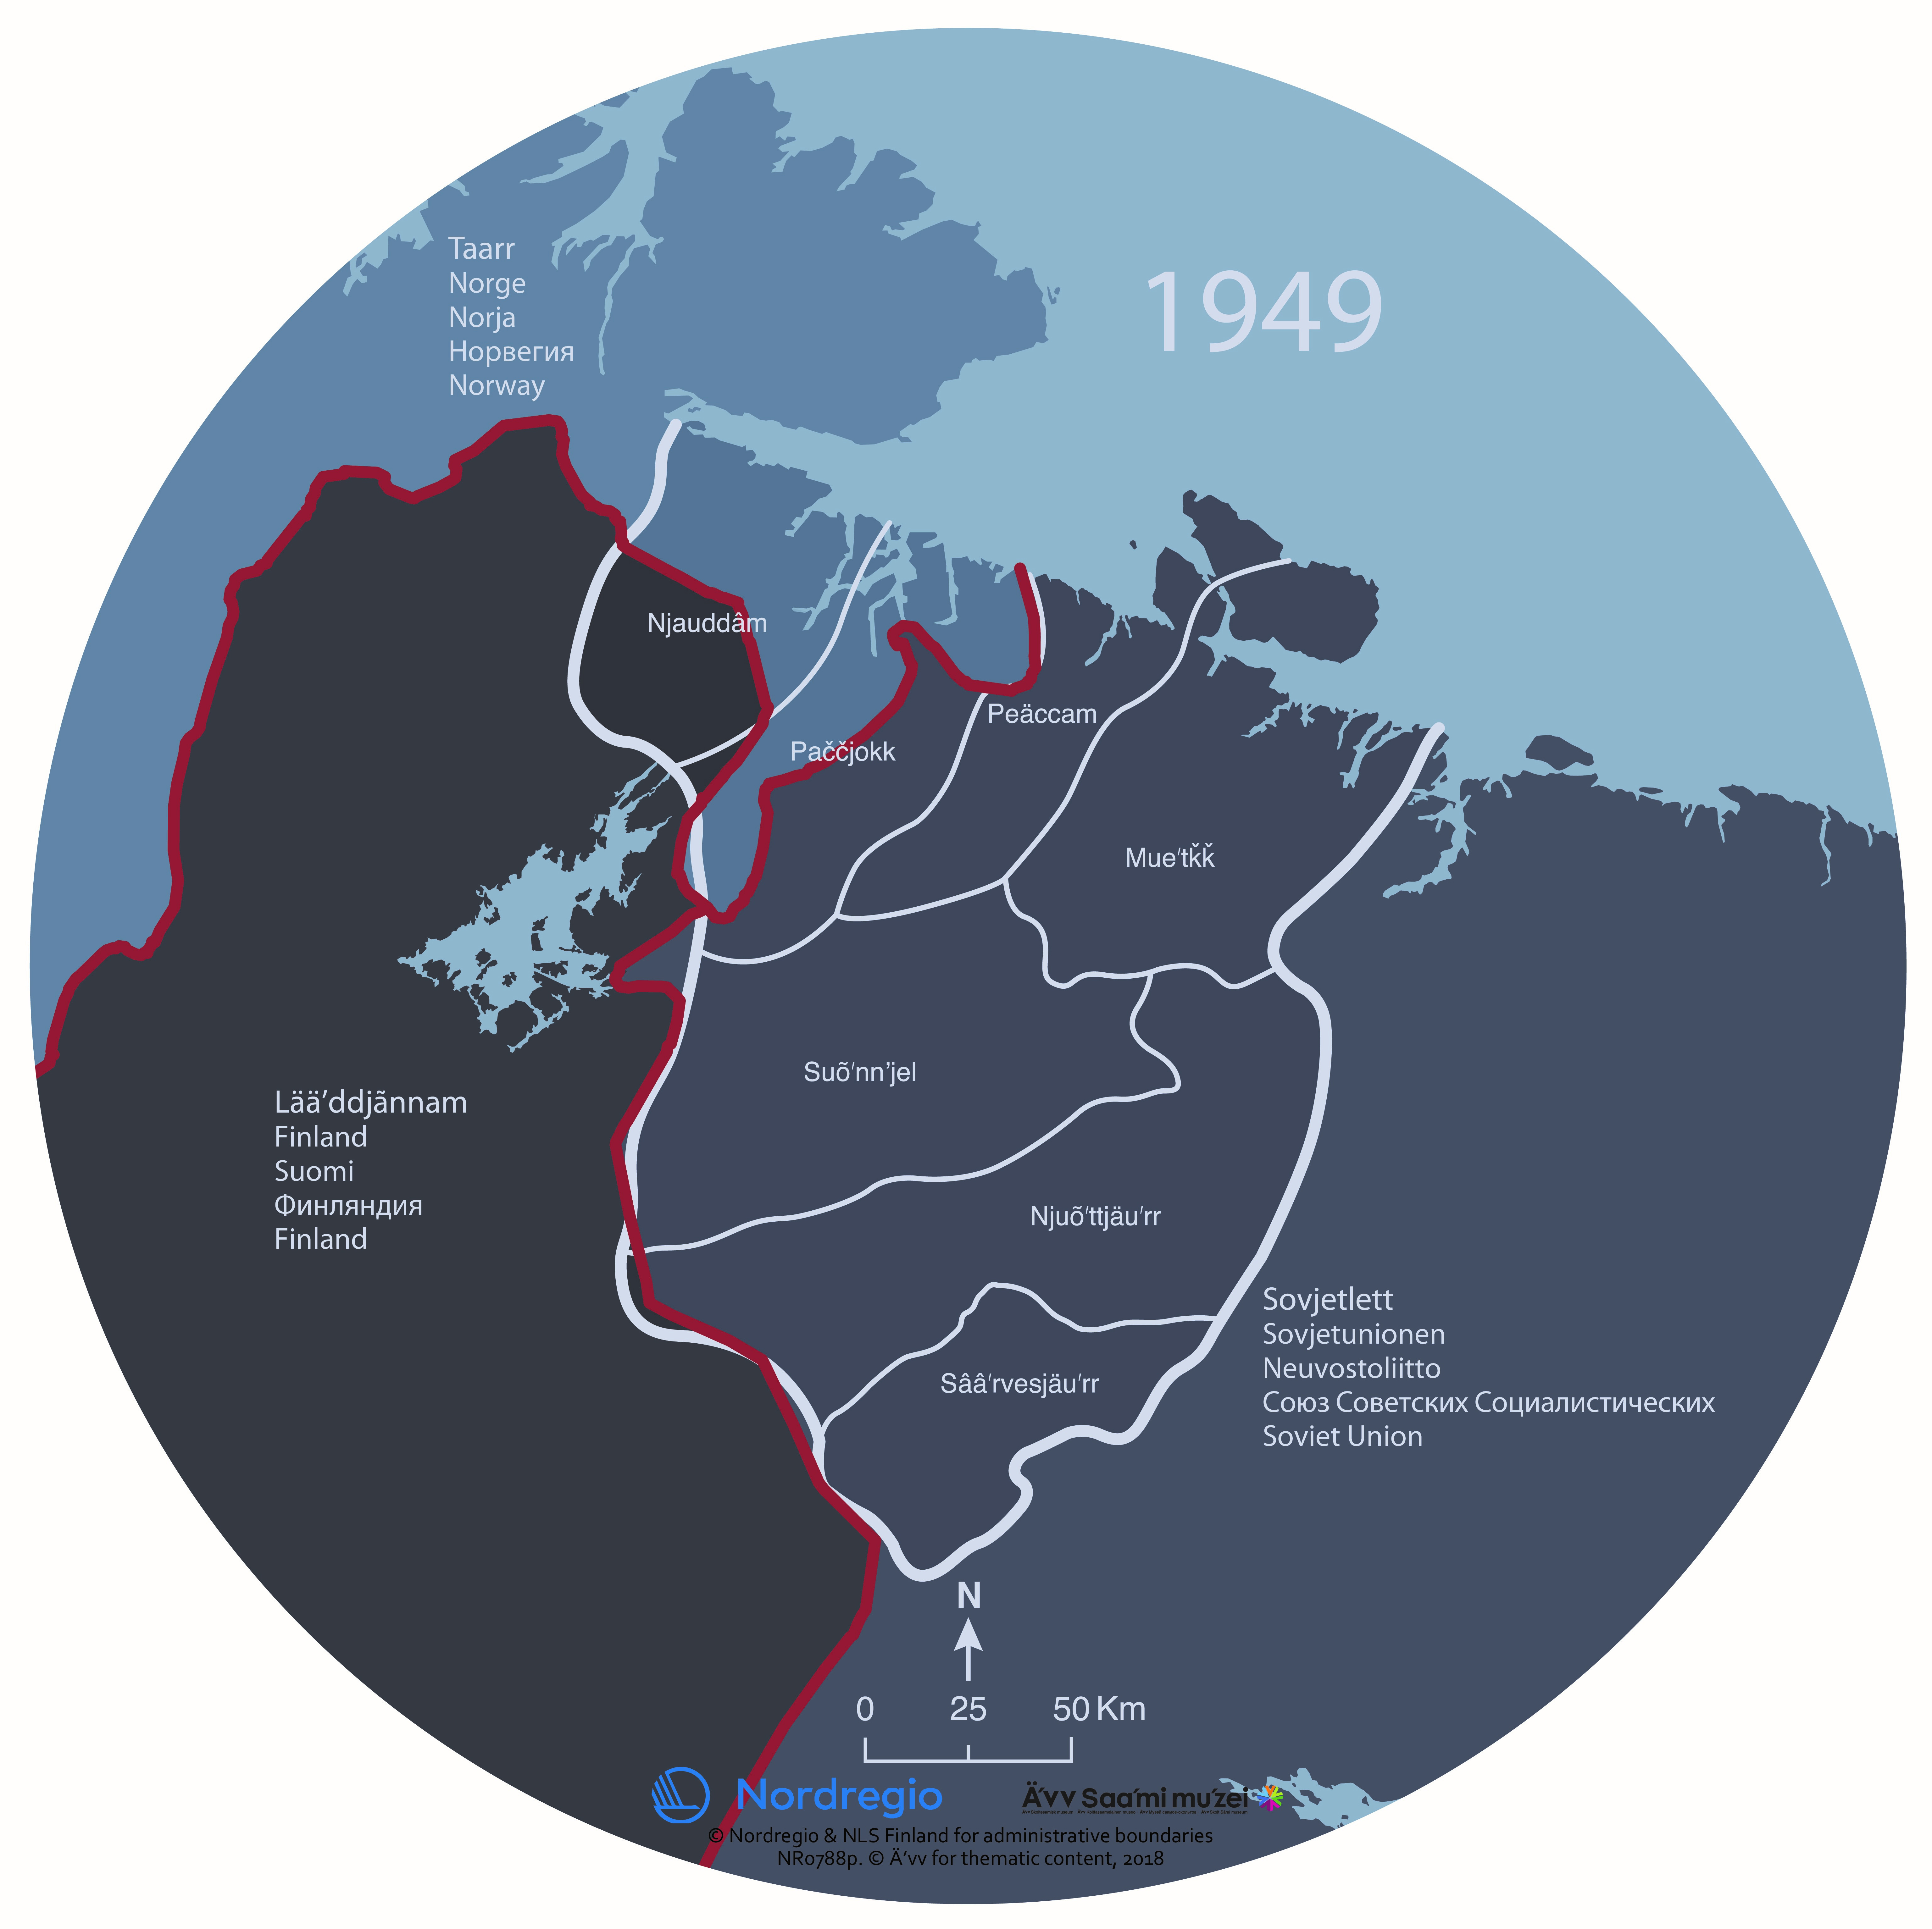
Saaʹmijânnam – Borders: 1949
The map shows the Skolt Sámi Land and the borders of national states in 1949. The Skolt Sámi Land is the home area for the indigenous Skolt Sámi people. During the Second World War, the Skolt Sámi land was the stage of violent acts of war. After the war, borders were again redrawn. The Soviet Union took the Petsamo area from Finland. The Skolt Sámi of Petsamo were given new settlement areas in north eastern Finland. In Norway and the Soviet Union, the Skolt Sámi remained an invisible minority. In all three countries, there was very little space for the Sámi. It took decades before the human rights of the Sámi received any attention. The map was produced for the exhibition Saaʹmijânnam – The Skolt Sámi Land in Äʹvv Skolt Sámi museum in Neiden, Norway. The map is the result of a collaboration between Äʹvv Skolt Sámi museum (responsible for the reconstruction of the Skolt Sámi areas and the exhibition), Yngvar Julin (concept of maps and exhibition architect), Nordregio (base maps) and Rethink. and illustrator Ruth Thomlevold (graphic design). Back to the main project page.
- 2018 January
- Administrative and functional divisions
- Arctic
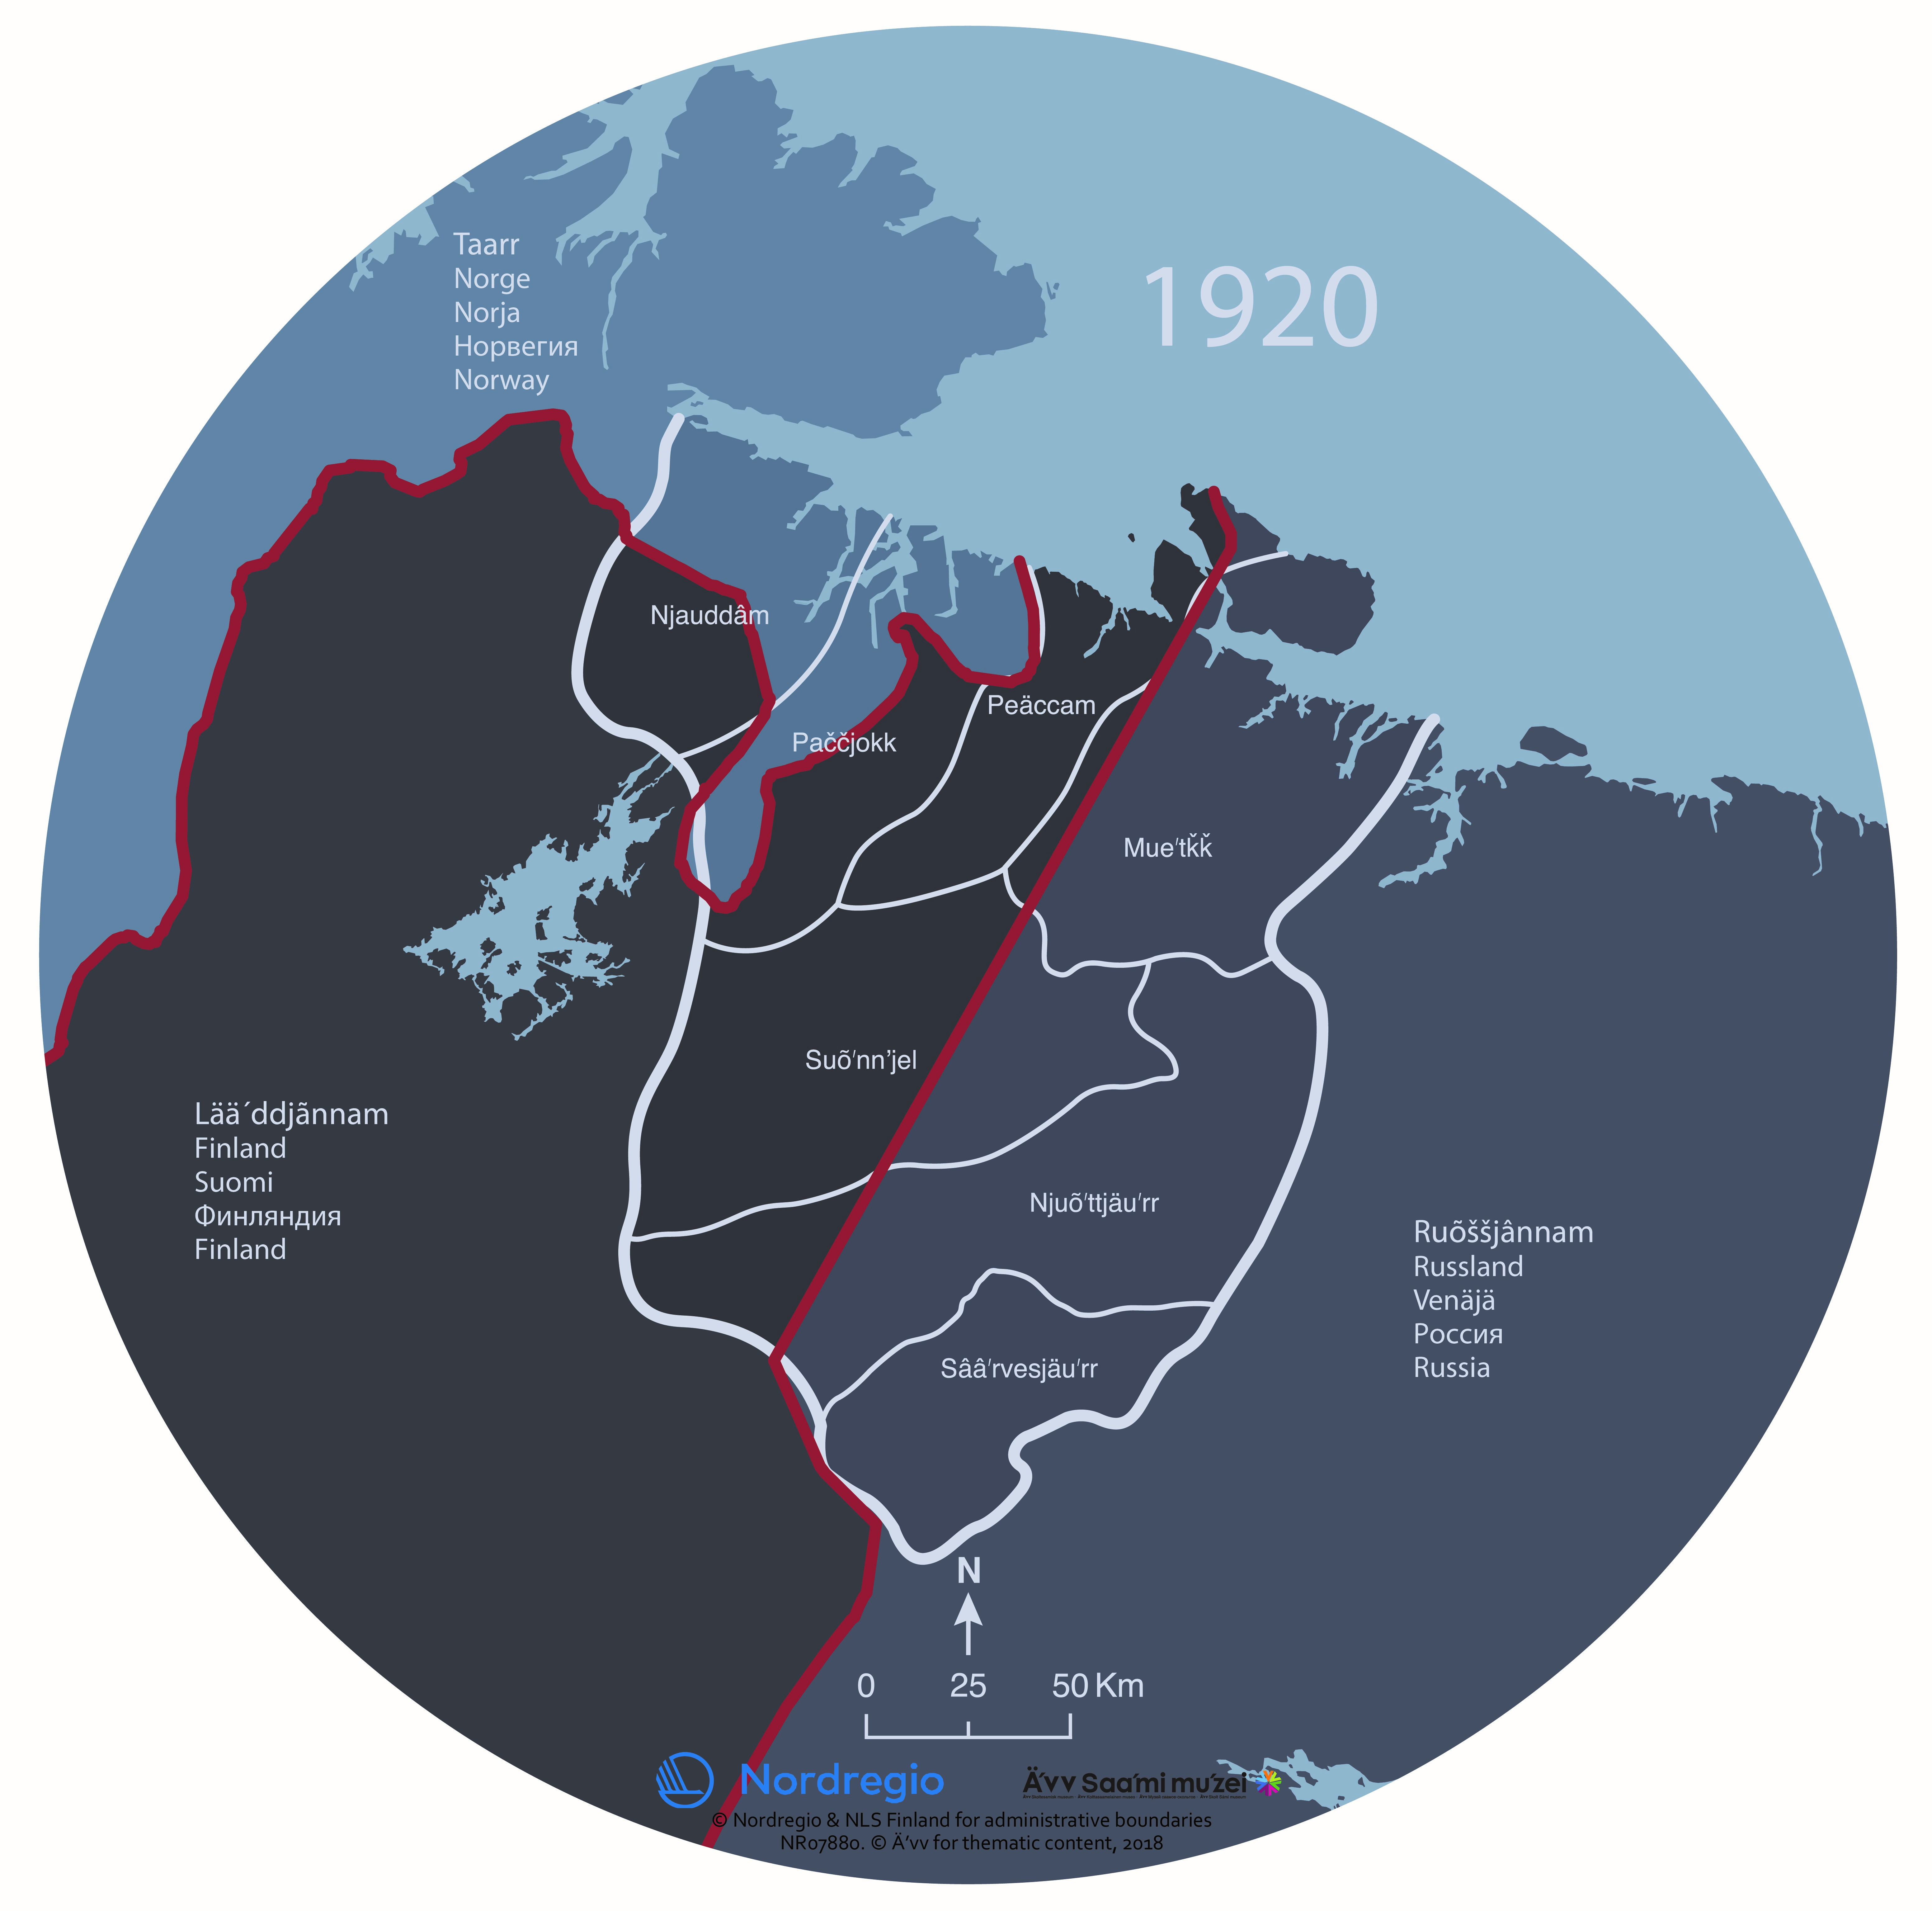
Saaʹmijânnam – Borders: 1920
The map shows the Skolt Sámi Land and the borders of national states in 1920. The Skolt Sámi Land is the home area for the indigenous Skolt Sámi people. The borders through the Skolt Sámi Land were redrawn after the First World War. Newly independent Finland obtained the Petsamo area and thereby access to the Arctic Ocean. The Skolt Sámi living in that area became citizens of Finland instead of Russia. In Norway, the Skolt Sámi suffered from Norwegianization. On the Russian side, the Skolt Sámi were persecuted due to Stalin’s minority group policies. It became difficult to follow seasonal migration routes, a typical of the Skolt Sámi way of life. The Skolt Sámi of Suenjel area were the only ones able to carry out this traditional lifestyle. The map was produced for the exhibition Saaʹmijânnam – The Skolt Sámi Land in Äʹvv Skolt Sámi museum in Neiden, Norway. The map is the result of a collaboration between Äʹvv Skolt Sámi museum (responsible for the reconstruction of the Skolt Sámi areas and the exhibition), Yngvar Julin (concept of maps and exhibition architect), Nordregio (base maps) and Rethink. and illustrator Ruth Thomlevold (graphic design). Back to the main project page.
- 2018 January
- Administrative and functional divisions
- Arctic
- Migration
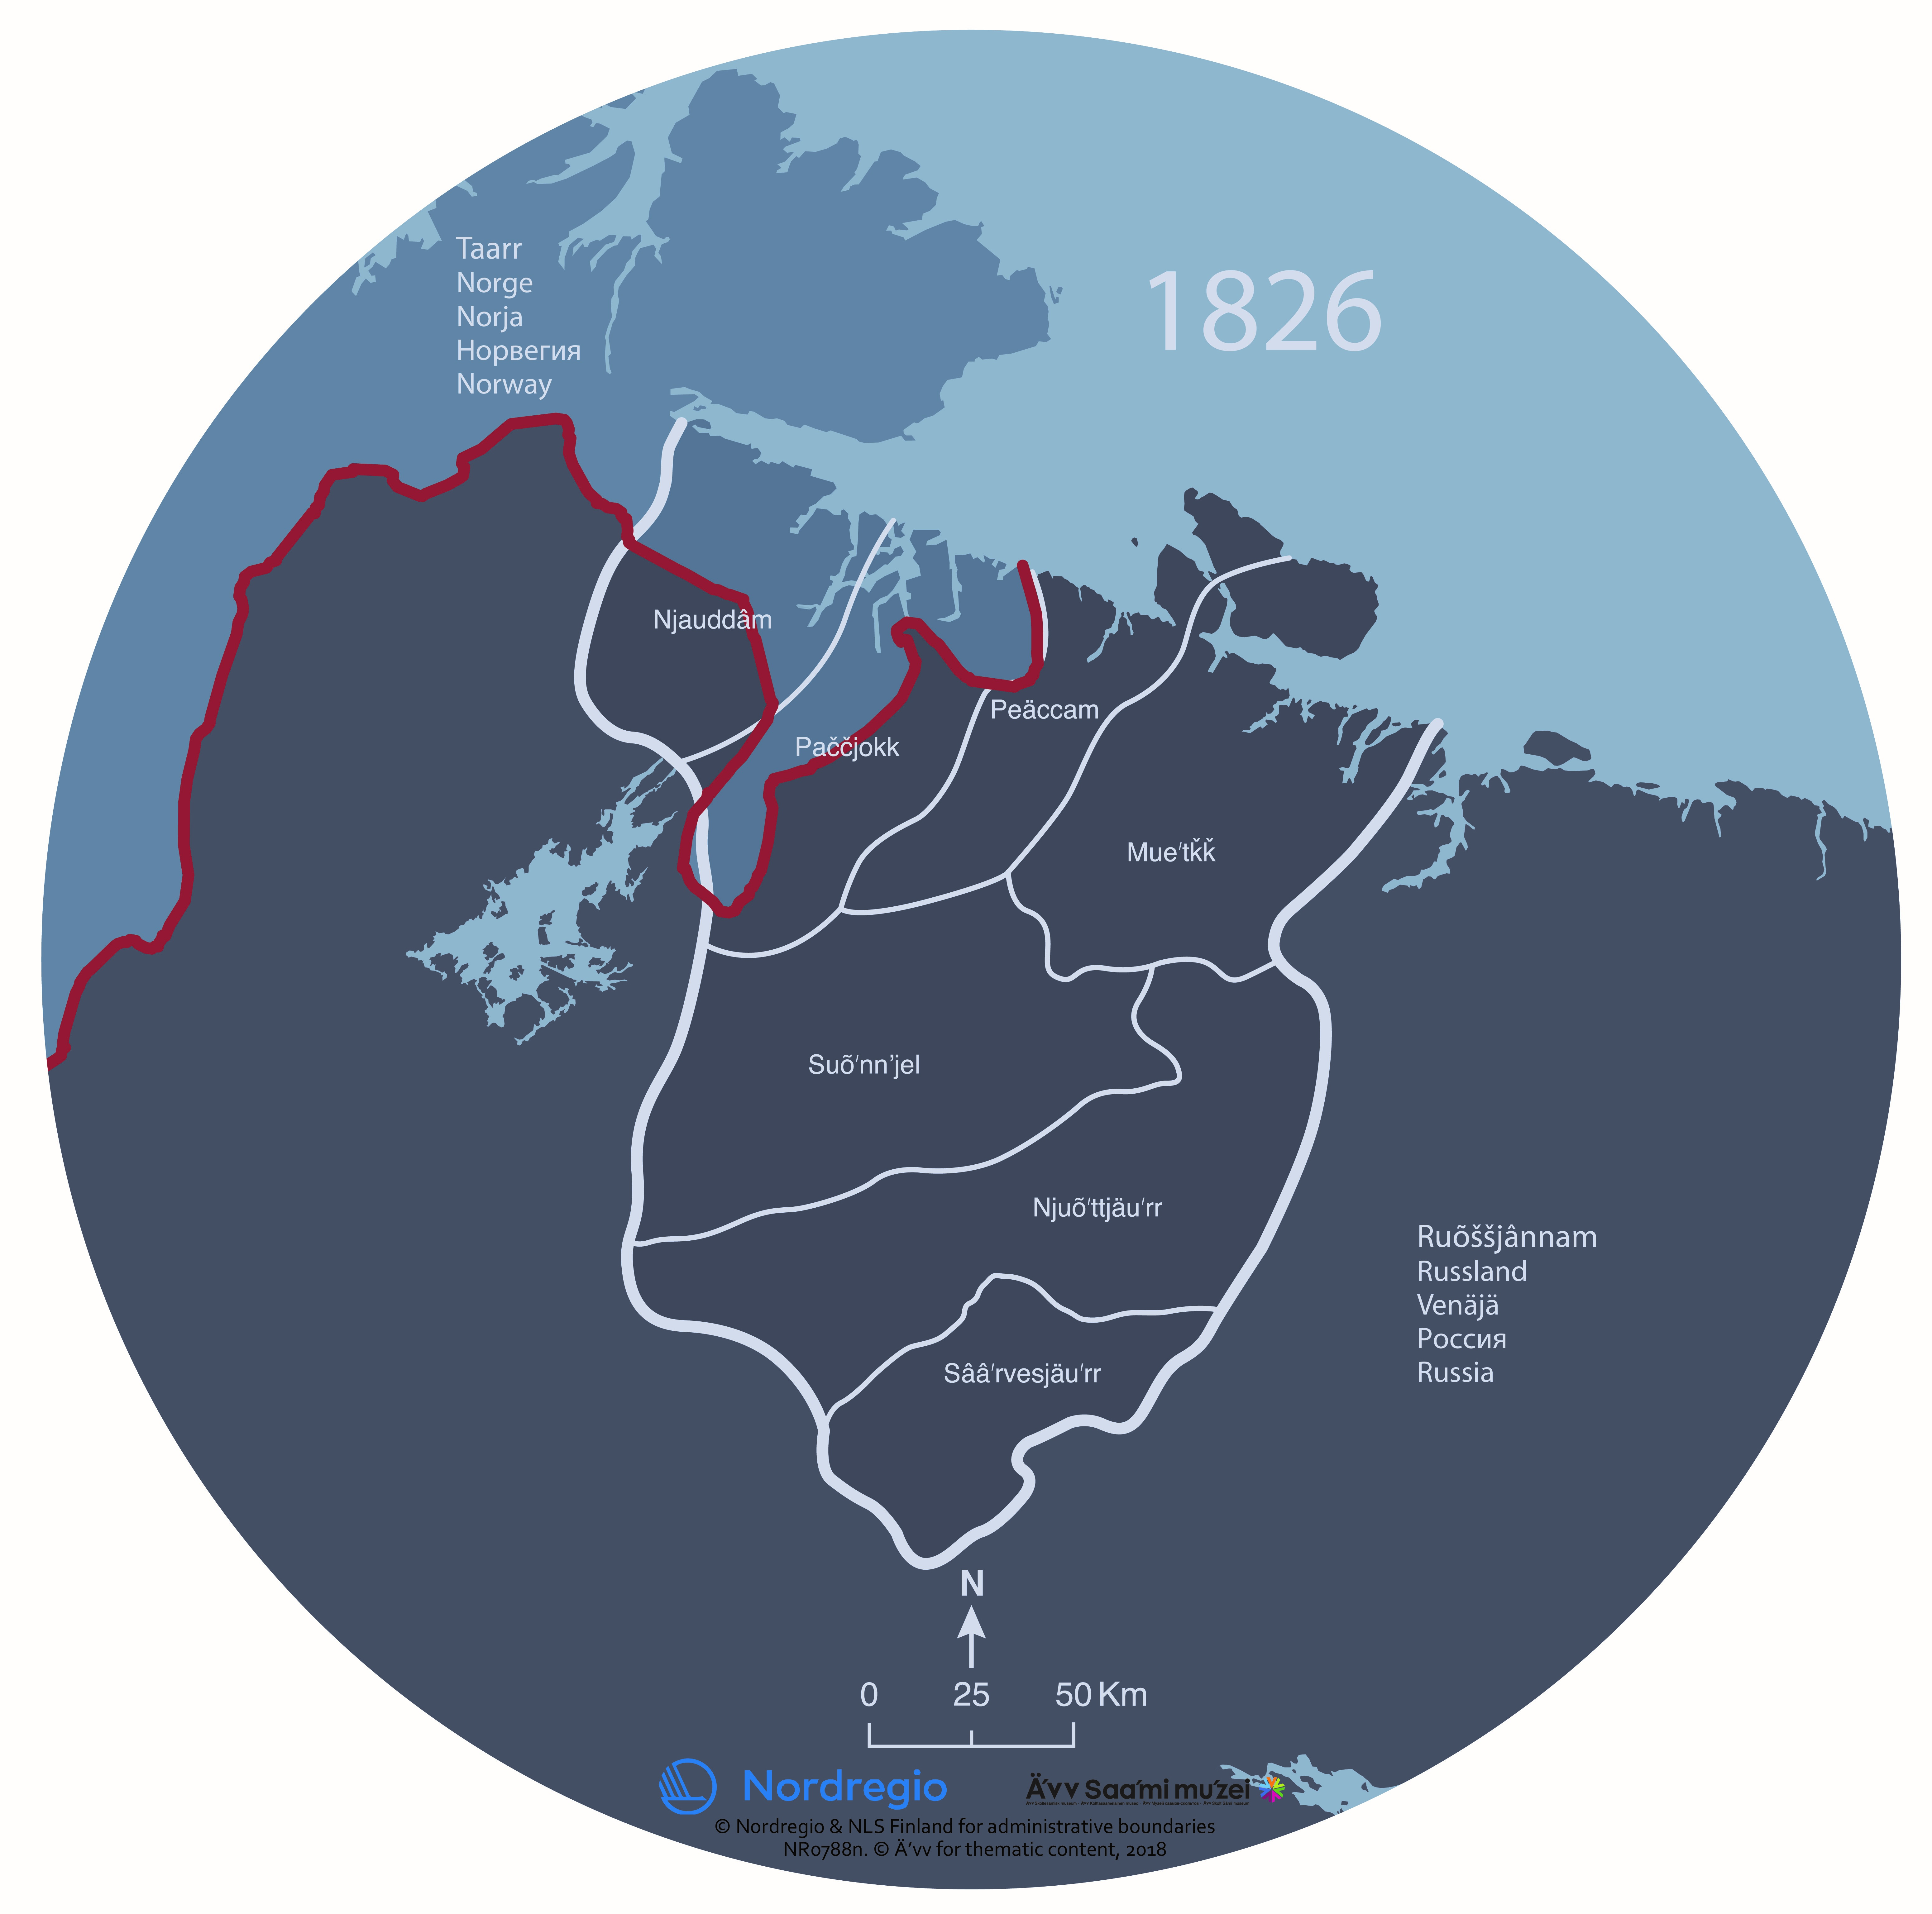
Saaʹmijânnam – Borders: 1826
The map shows how the borders of the national states in 1826 divided the Skolt Sámi Land. The Skolt Sámi Land is the home area for the indigenous Skolt Sámi people. Drawing the borders in 1826 has had a dramatic effect on the Skolt Sámi. Neiden and Pasvik areas were divided between Norway and Russia. The Skolt Sámi lost extensive parts of their living areas and their rights. They became citizens of two countries. Due to a growing number of immigrants, the competition for resources and land increased. The map was produced for the exhibition Saaʹmijânnam – The Skolt Sámi Land in Äʹvv Skolt Sámi museum in Neiden, Norway. The map is the result of a collaboration between Äʹvv Skolt Sámi museum (responsible for the reconstruction of the Skolt Sámi areas and the exhibition), Yngvar Julin (concept of maps and exhibition architect), Nordregio (base maps) and Rethink. and illustrator Ruth Thomlevold (graphic design). Back to the main project page.
- 2018 January
- Administrative and functional divisions
- Arctic
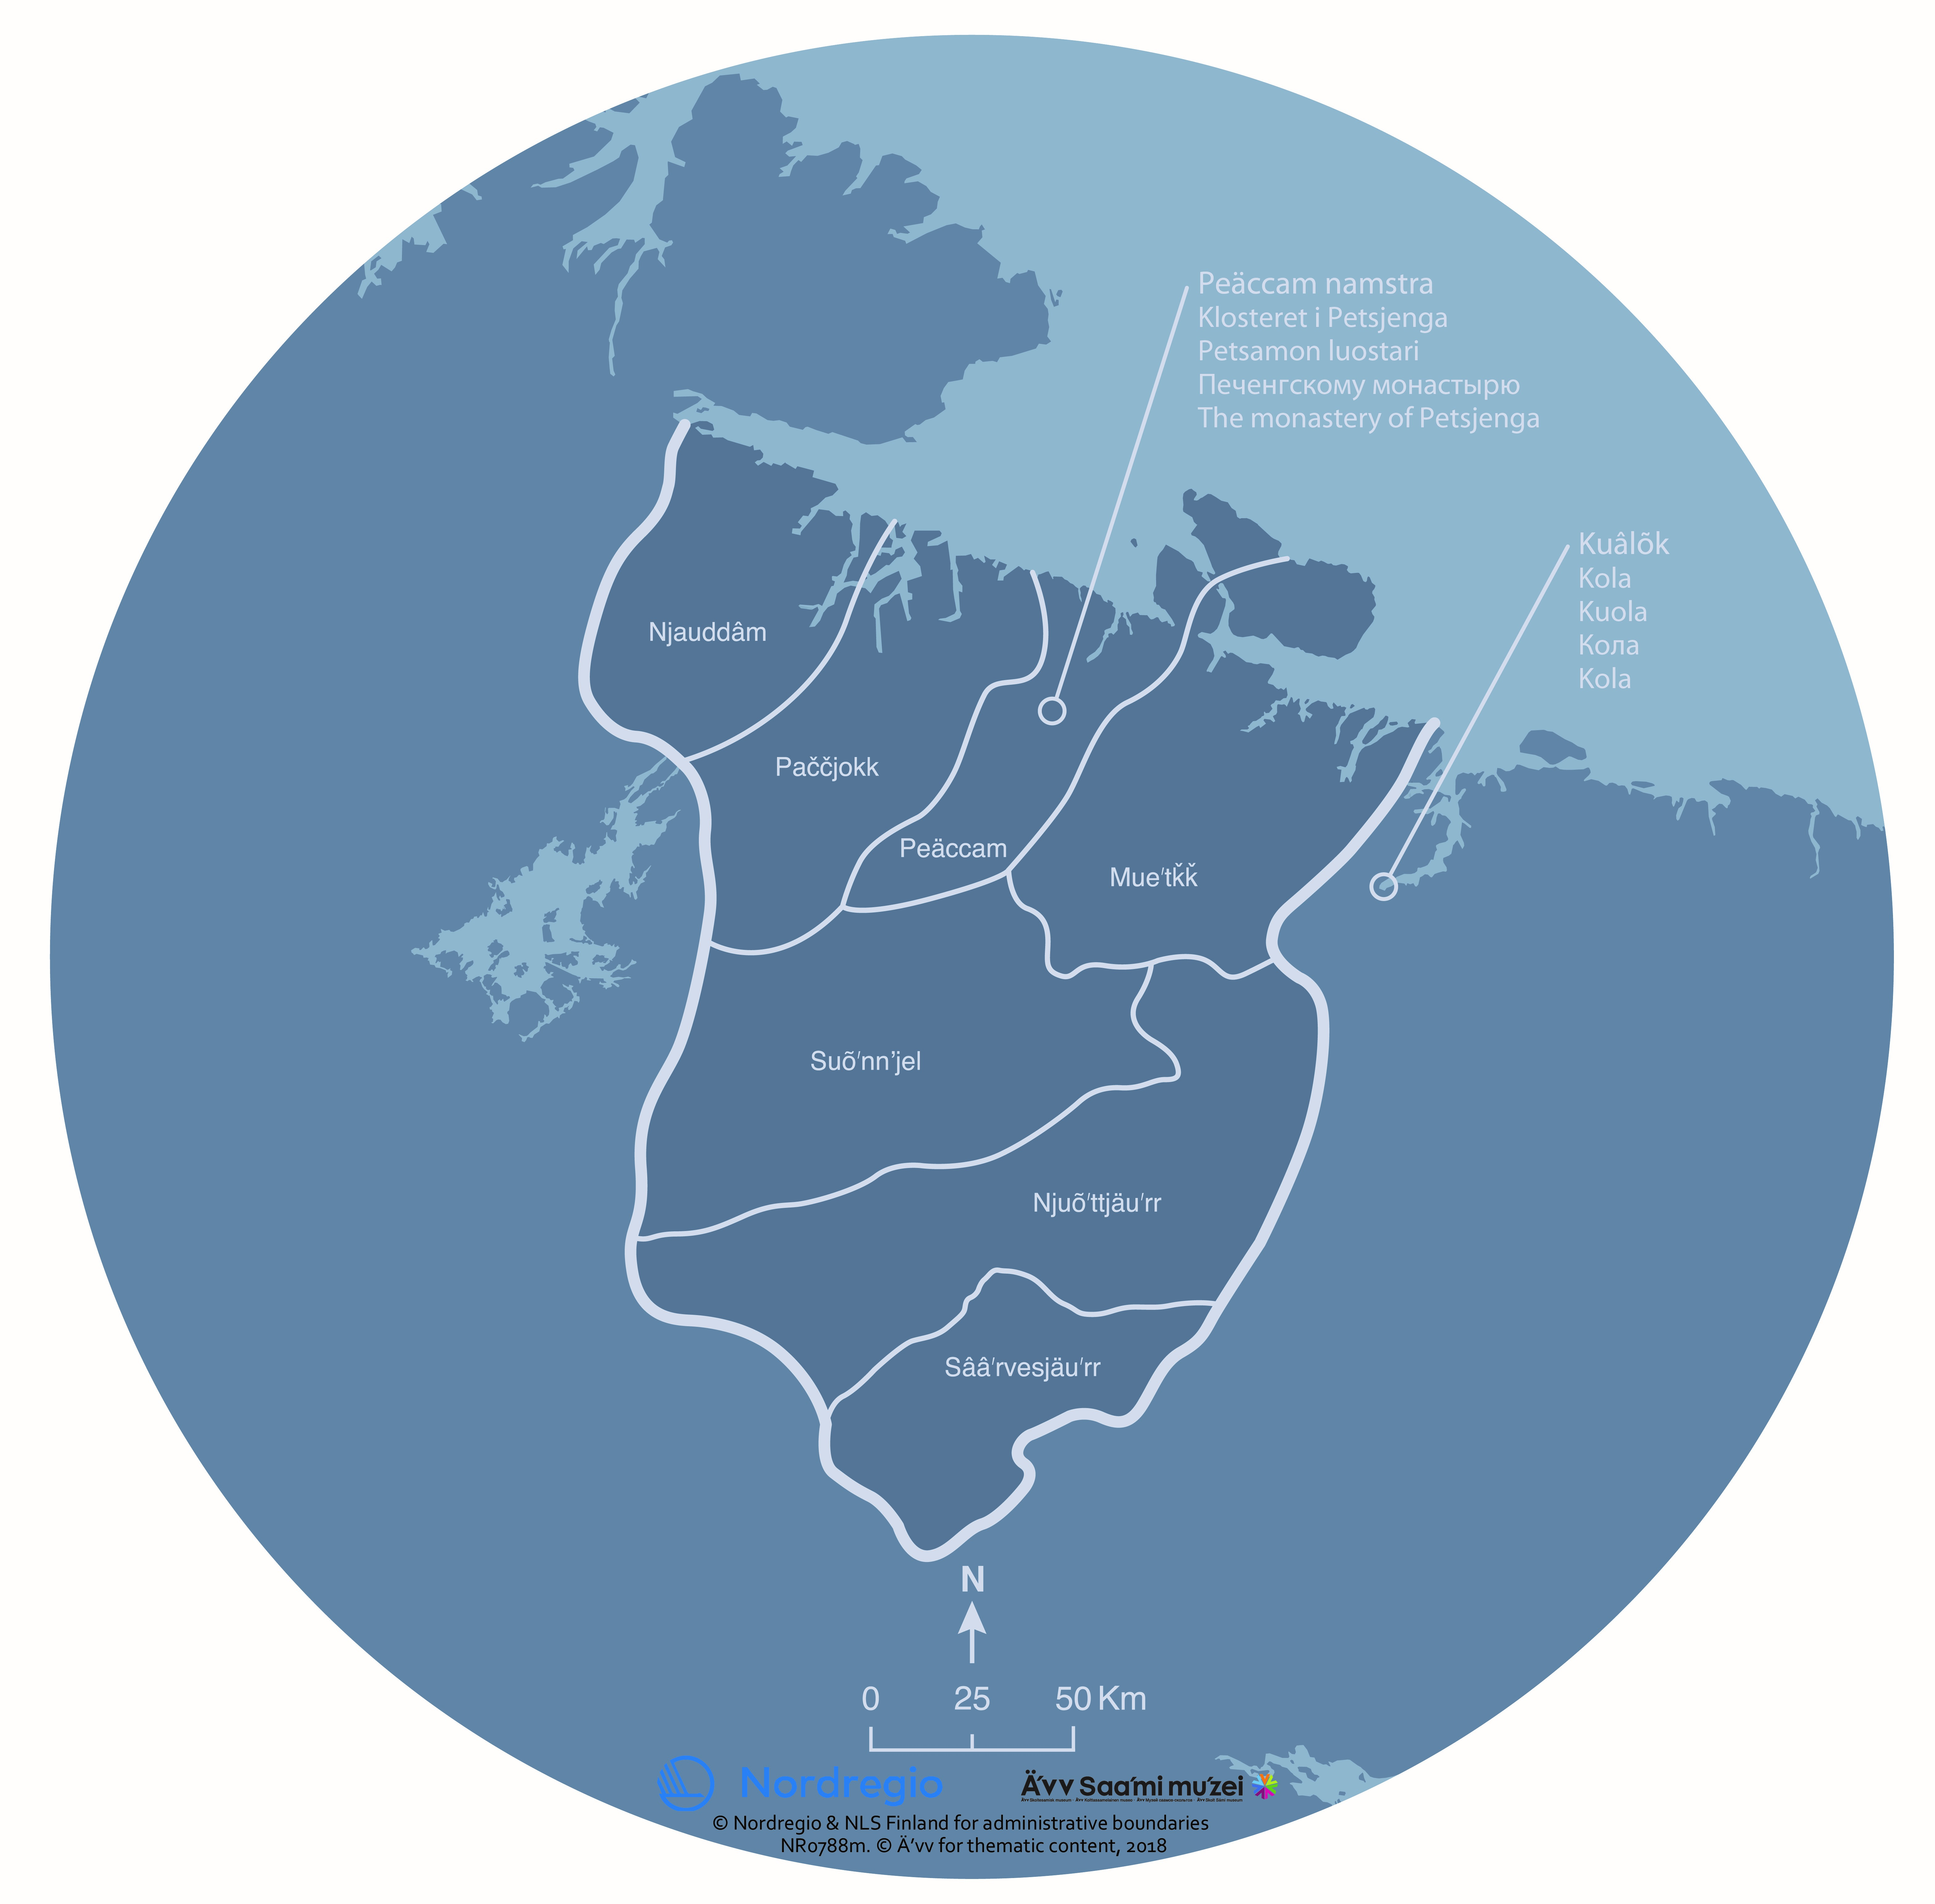
Saaʹmijânnam – the History: The monastery of Petsjenga and the fortress of Kola
The map shows the historical Skolt Sámi Land, the monastery of Petsjenga and the fortress of Kola. The Skolt Sámi Land is the home area for the indigenous Skolt Sámi people. The Russian tsar gave Skolt Sámi areas to the monastery of Petsjenga in 1556. The monastery operated a very successful business in reindeer herding, cooking salt and fishing. Petsjenga and Muetke sijdds were repressed under the monastery’s rule. The tsar had placed his officials at the fortress of Kola, in order to look after his interests in the northern areas. The map was produced for the exhibition Saaʹmijânnam – The Skolt Sámi Land in Äʹvv Skolt Sámi museum in Neiden, Norway. The map is the result of a collaboration between Äʹvv Skolt Sámi museum (responsible for the reconstruction of the Skolt Sámi areas and the exhibition), Yngvar Julin (concept of maps and exhibition architect), Nordregio (base maps) and Rethink. and illustrator Ruth Thomlevold (graphic design). Back to the main project page.
- 2018 January
- Administrative and functional divisions
- Arctic
- Others
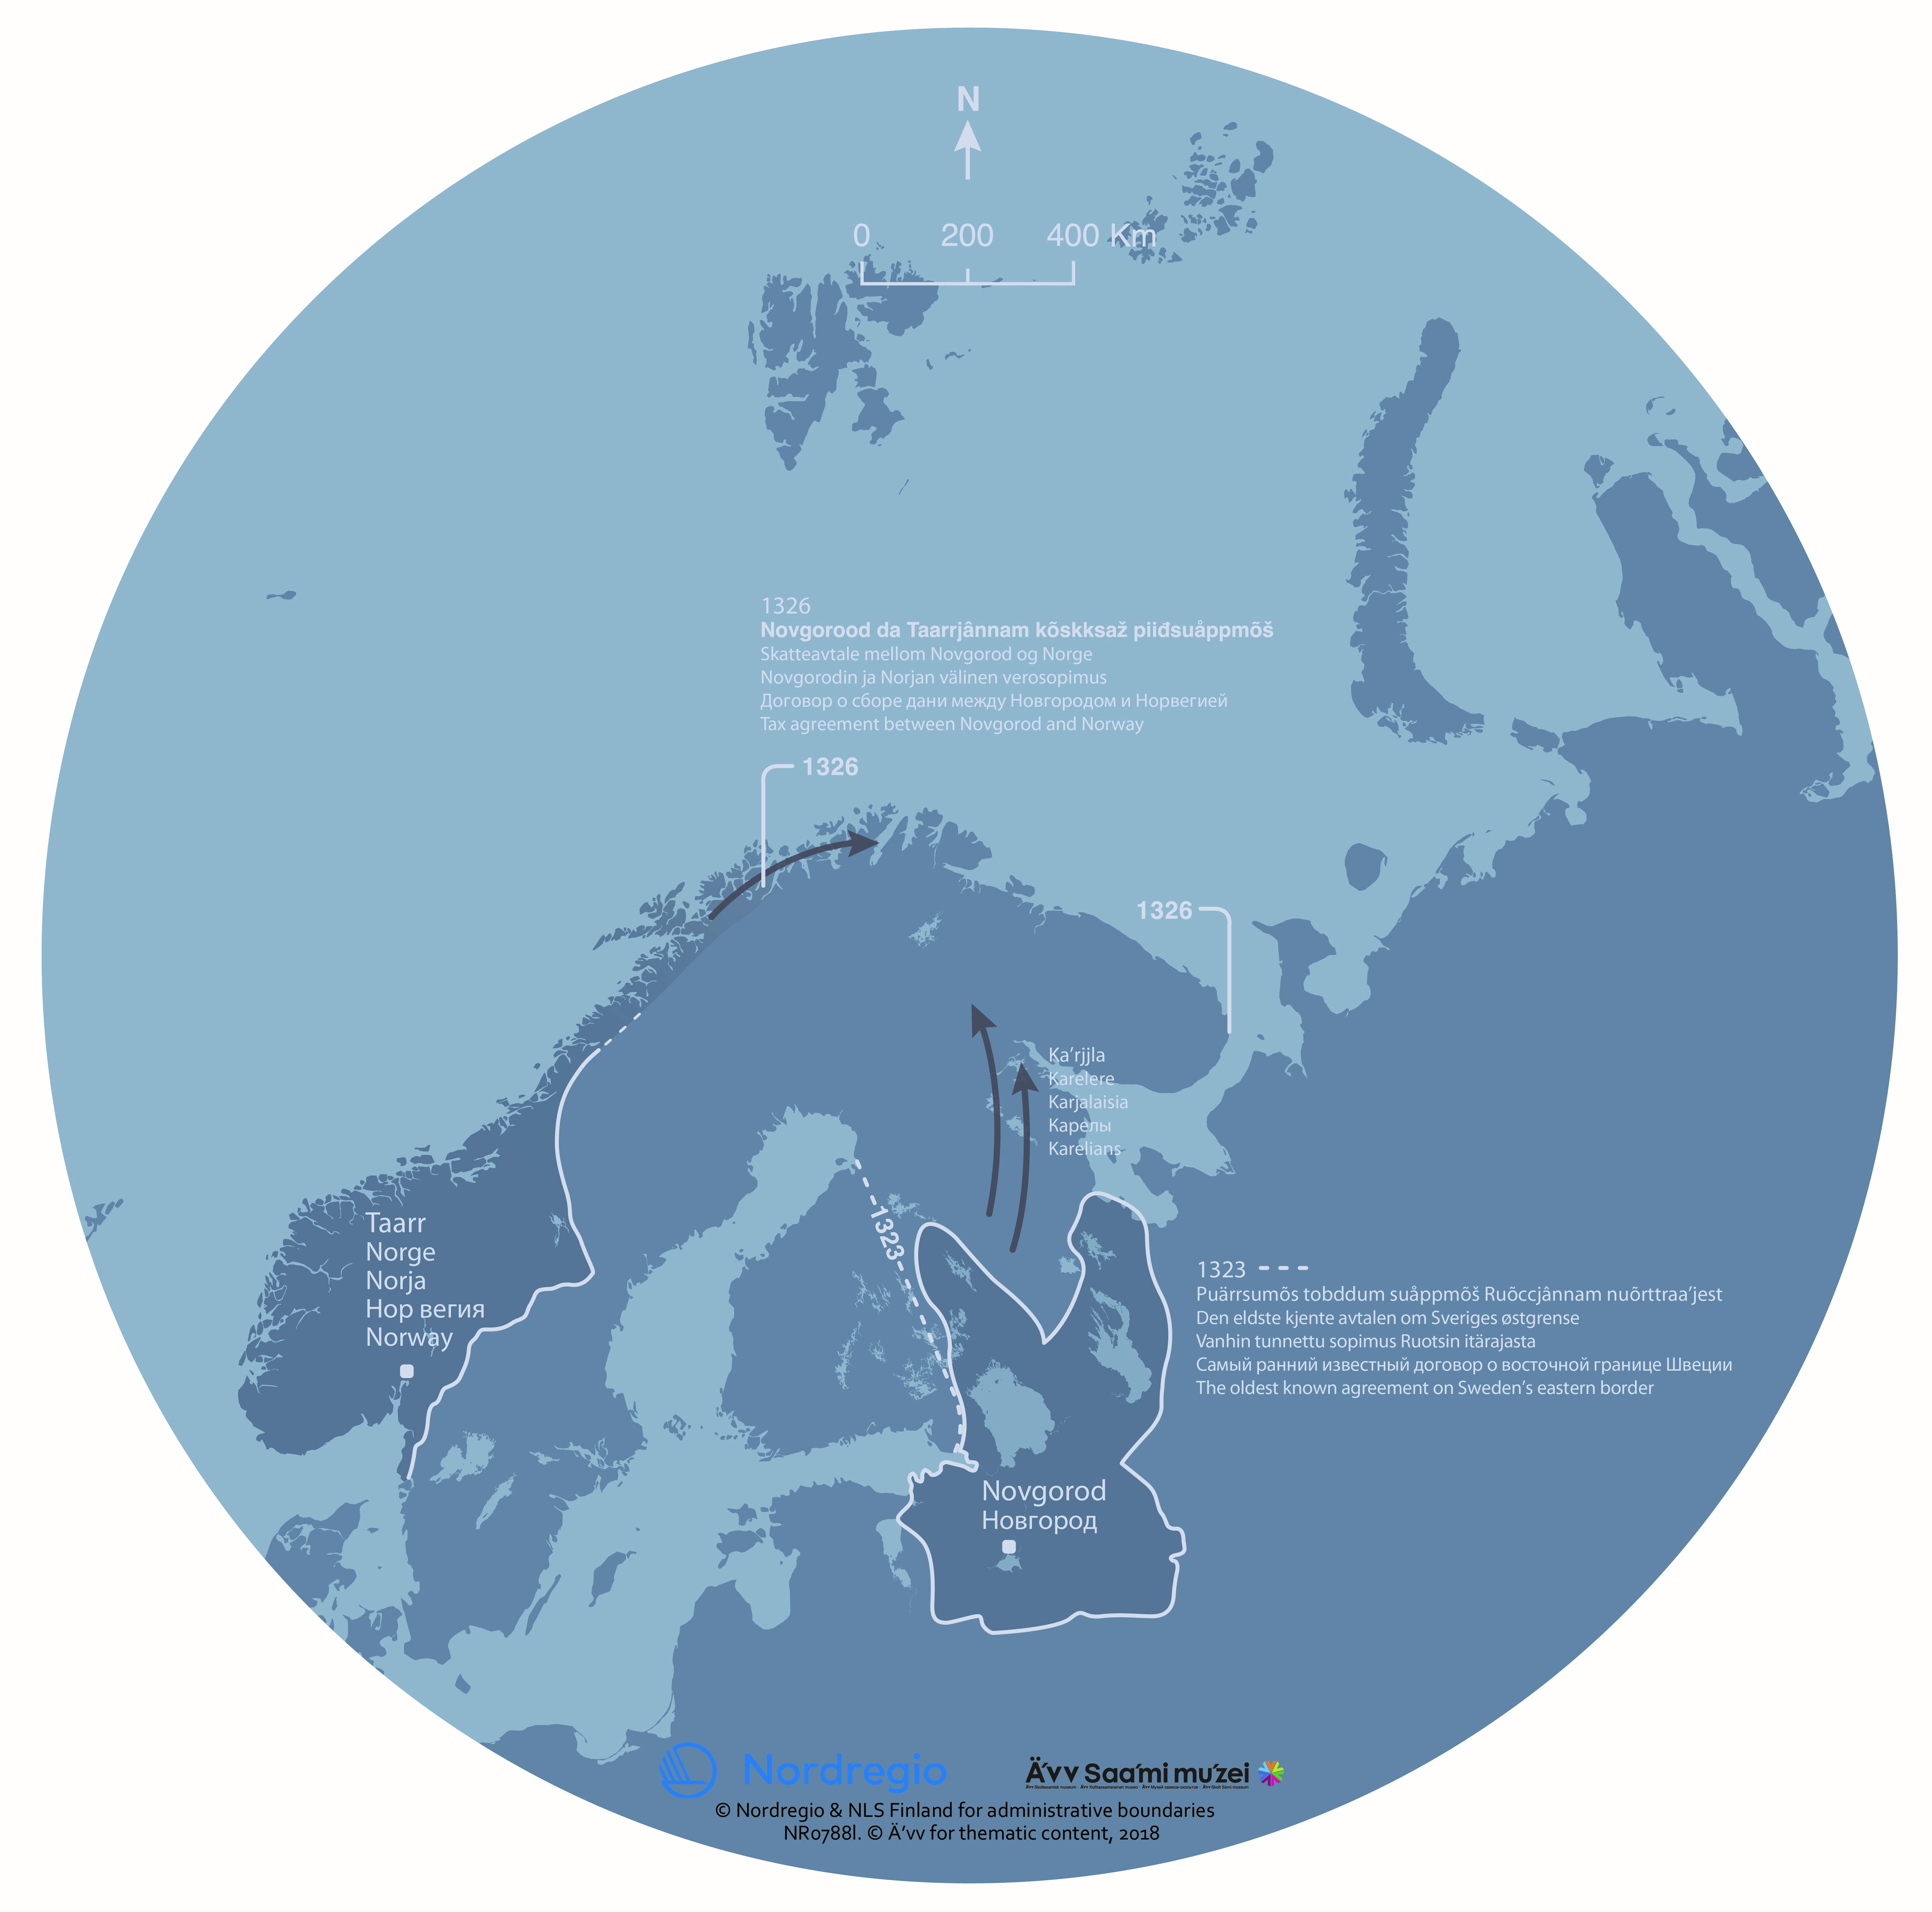
Saaʹmijânnam – the History: Taxation and borders in 14th century
The map shows some of the borders in 14th century around the Skolt Sámi Land. The Skolt Sámi Land is the home area for the indigenous Skolt Sámi people. In 1326, the treaty of Novgorod led to the Sámi being taxed twofold. The Sámi areas were under pressure from both the east and the west. Karelian and Norwegian settlements spread to the north. Karelians collected taxes from the Sámi, as they themselves were obliged to pay taxes to Novgorod. The map was produced for the exhibition Saaʹmijânnam – The Skolt Sámi Land in Äʹvv Skolt Sámi museum in Neiden, Norway. The map is the result of a collaboration between Äʹvv Skolt Sámi museum (responsible for the reconstruction of the Skolt Sámi areas and the exhibition), Yngvar Julin (concept of maps and exhibition architect), Nordregio (base maps) and Rethink. and illustrator Ruth Thomlevold (graphic design). Back to the main project page.
- 2018 January
- Administrative and functional divisions
- Arctic

Saaʹmijânnam – the History: Assumed distribution of ethnic groups around year 500
The map shows the assumed distribution of ethnic groups in Northern Europe around year 500. The map was produced for the exhibition Saaʹmijânnam – The Skolt Sámi Land in Äʹvv Skolt Sámi museum in Neiden, Norway. The map is the result of a collaboration between Äʹvv Skolt Sámi museum (responsible for the reconstruction of the areas and the exhibition), Yngvar Julin (concept of maps and exhibition architect), Nordregio (base maps), Martin Skulstad, Rethink. and Ruth Thomlevold (graphic design) and Christian Carpelan (reconstruction of the areas). Back to the main project page.
- 2018 January
- Administrative and functional divisions
- Arctic
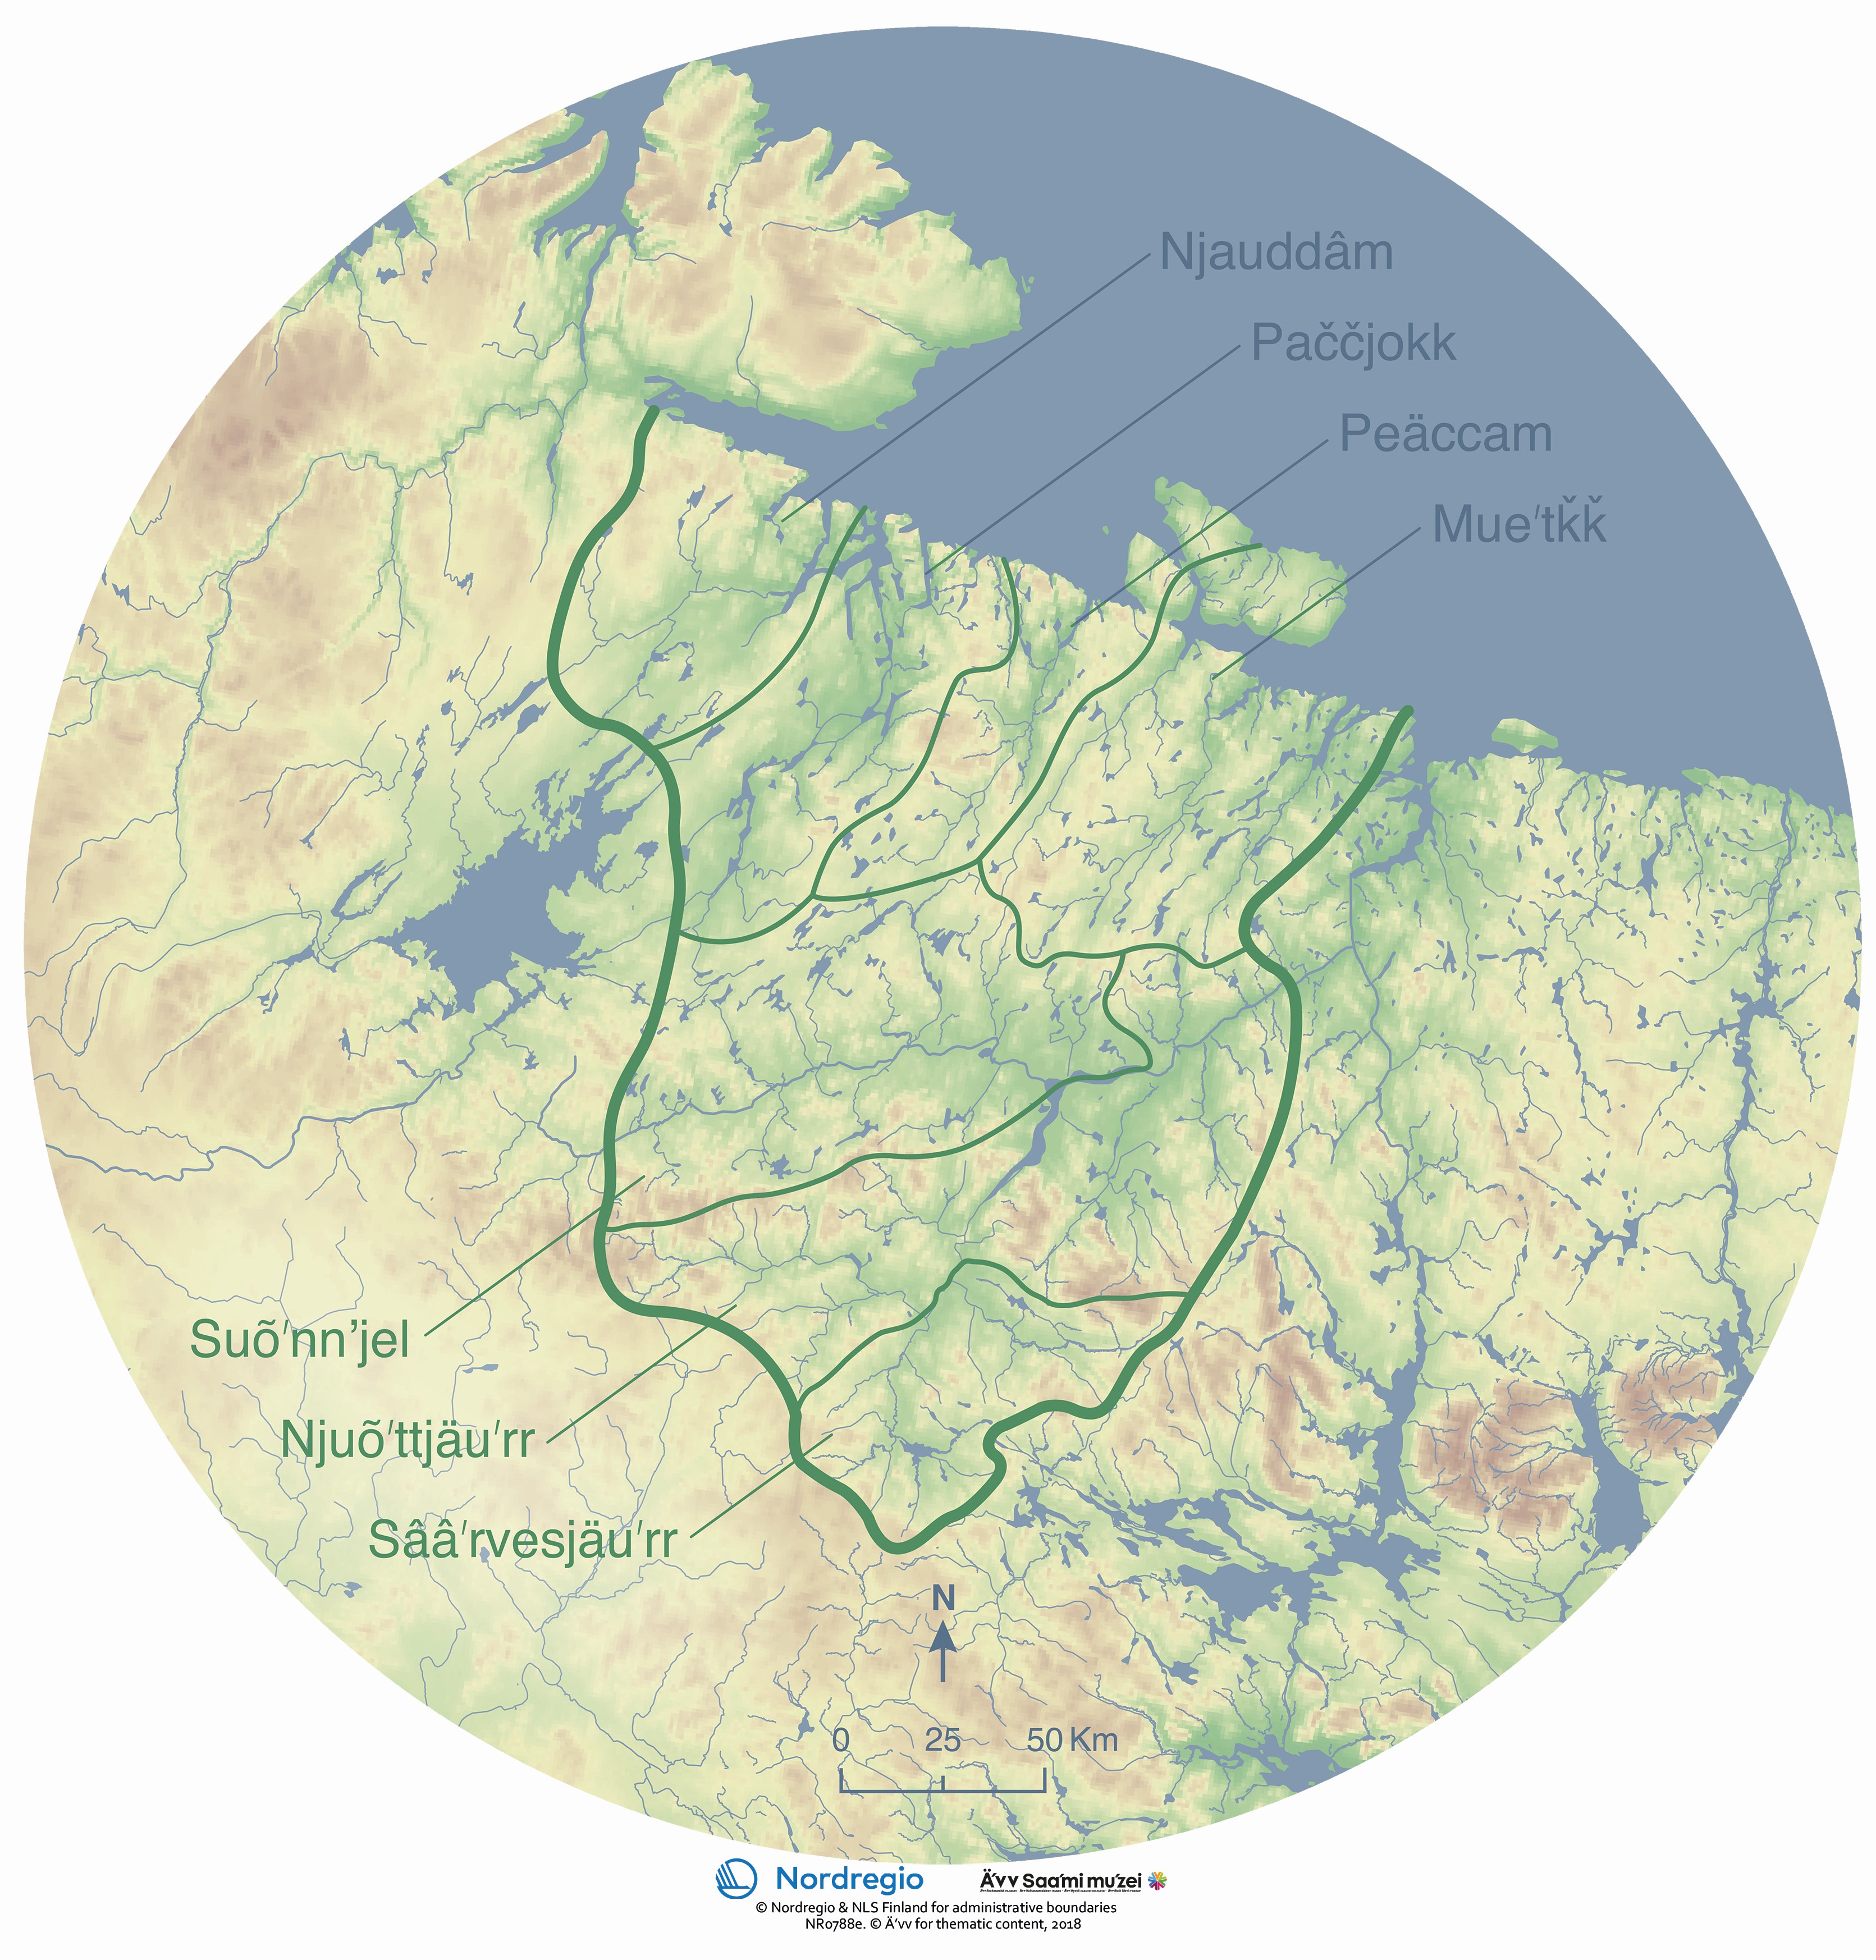
Saaʹmijânnam – the Community: Location of the Skolt Sámi sijdds with water bodies and elevation
The map shows the location of the seven Skolt Sámi sijjds. The word sijdd refers both to a geographic area and to the people who use it. The Skolt Sámi are an indigenous people with a unique culture and history. In the past, the Skolt Sámi knew exactly which areas belonged to their sijdd. If necessary, the borders of the sijdd could be redrawn by oral agreements. There were strong social ties between the Skolt Sámi areas. Marriages across sijdds were common. In some places, this sijdd system continued until World War II. In the past, the Skolt Sámi moved between several dwelling sites throughout the year. During winter, all the families of the sijdd moved to a common winter settlement. The Skolt Sámi lived on fishing, hunting and gathering. They also kept some reindeer and sheep. The resources of the sijdd were considered collective property, however movables and buildings were owned by individuals. This map shows the water bodies (lakes and rivers) according to their historical extent and location, before they were dammed up or given new courses during the 20th century. The map was produced for the exhibition Saaʹmijânnam – The Skolt Sámi Land in Äʹvv Skolt Sámi museum in Neiden, Norway. The map is the result of a collaboration between Äʹvv Skolt Sámi museum (responsible for the reconstruction of the Skolt Sámi areas and the exhibition), Yngvar Julin (concept of maps and exhibition architect), Nordregio (base maps) and Rethink. and illustrator Ruth Thomlevold (graphic design). Back to the main project page.
- 2018 January
- Administrative and functional divisions
- Arctic

Saaʹmijânnam – the Community: Location of the Skolt Sámi sijdds
The map shows the location of the seven Skolt Sámi sijjds. The word sijdd refers both to a geographic area and to the people who use it. The Skolt Sámi are an indigenous people with a unique culture and history. In the past, the Skolt Sámi knew exactly which areas belonged to their sijdd. If necessary, the borders of the sijdd could be redrawn by oral agreements. There were strong social ties between the Skolt Sámi areas. Marriages across sijdds were common. In some places, this sijdd system continued until World War II. The map was produced for the exhibition Saaʹmijânnam – The Skolt Sámi Land in Äʹvv Skolt Sámi museum in Neiden, Norway. The map is the result of a collaboration between Äʹvv Skolt Sámi museum (responsible for the reconstruction of the Skolt Sámi areas and the exhibition), Yngvar Julin (concept of maps and exhibition architect), Nordregio (base maps) and Rethink. and illustrator Ruth Thomlevold (graphic design). Back to the main project page.
- 2018 January
- Administrative and functional divisions
- Arctic

Saaʹmijânnam – the Community: Location of the Skolt Sámi Land
The map shows the location of the Skolt Sámi Land. The Skolt Sámi Land is the home area for the indigenous Skolt Sámi people. The Skolt Sámi are an indigenous people with a unique culture and history. Starting in 1826, various state borders were drawn through the Skolt Sámi homeland. Today, at least a thousand people can claim Skolt Sámi ancestry. Most of them are citizens of Norway, Finland and Russia. The Skolt Sámi Land is located in an area which today is divided between Norway, Finland and Russia. The map was produced for the exhibition Saaʹmijânnam – The Skolt Sámi Land in Äʹvv Skolt Sámi museum in Neiden, Norway. The map is the result of a collaboration between Äʹvv Skolt Sámi museum (responsible for the reconstruction of the Skolt Sámi areas and the exhibition), Yngvar Julin (concept of maps and exhibition architect), Nordregio (base maps) and Rethink. and illustrator Ruth Thomlevold (graphic design). Back to the main page.
- 2018 January
- Administrative and functional divisions
- Arctic
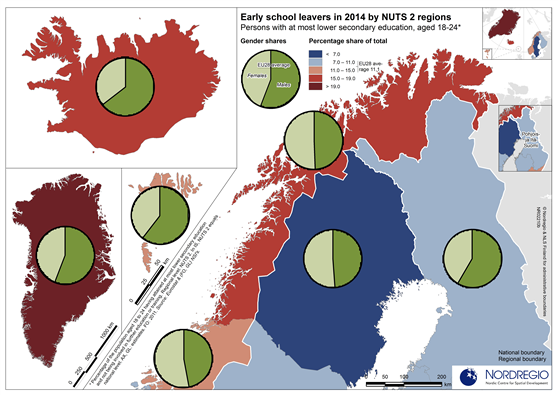
Early school leavers in 2014 by NUTS 2 regions
Persons with at most lower secondary education as share of total population aged 18-24 The map indicates variations within the Nordic countries with the lowest rates of early school leaving found in Swedish regions. In six of the eight Swedish NUTS 2 regions (riksområden) early school leavers make up less than seven percent of the population aged 18-24 years. Hovedstaden in Denmark is the only other Nordic region with a similar rate. In Finland (suuralue/storområde) and Norway (landsdel), variations between the NUTS 2 regions are bigger than in Sweden and Denmark. In the northernmost Finnish region, Pohjois- ja Itä-Suomi (North & East Finland), early school leavers make up a small portion of the population aged 18-24 years, below both the EU average (11.1%) and the two southernmost Finnish NUTS 2 regions. In the Faroe Islands, Iceland, Northern Norway, and, in particular, Greenland, the percentage of the population aged 18-24 years with lower-secondary school as their highest level of education is well above the EU average. With respect to gender, the balance is fairly even in northern Sweden and northern Norway. All other countries and regions included in the map show patterns consistent with the EU average, with males making up a larger portion of the early school leaving population.
- 2016 October
- Labour force
- NSPA and North Atlantic